
I have never met a coach that didn’t want some advantage going into competition. Dartfish has just announced a major update to its baseball-softball coaching toolset, giving coaches an advantage through our new game planning and player preparation tools.
This new update focuses on coaching staff efficiency in developing and executing game plans. It provides new predictive graphical reports, replacing the tedious process of coaches having to watch game video and create manual notes on players. The reports are automatically generated from charting data and can be viewed interactively or printed in PDF format.
The graphical reports can also be used to filter pitch video and create smart video playlists on the opponent’s pitchers and hitters. This video link can be shared with the players to view in team meetings or for review on their mobile phones – anytime, anywhere.
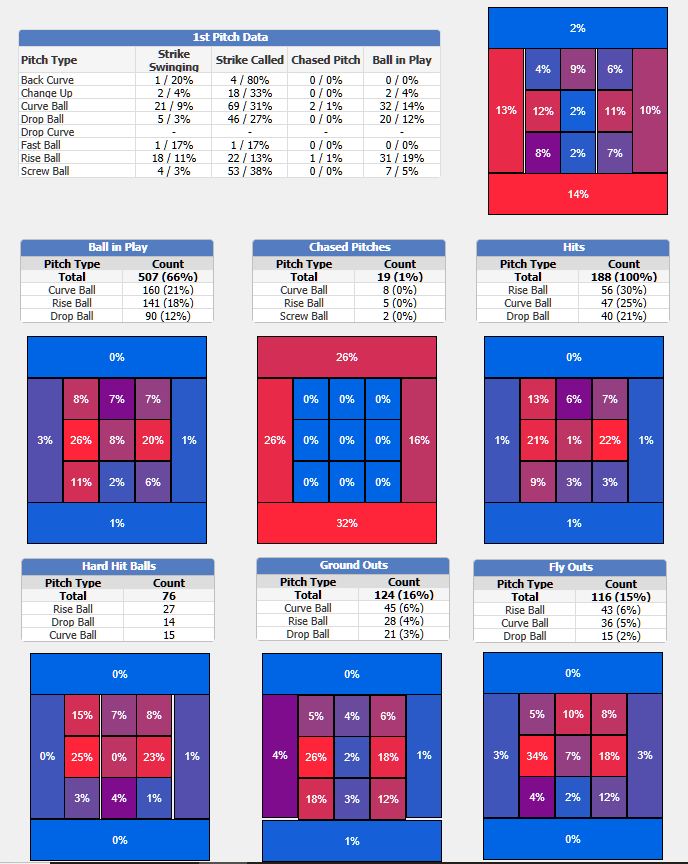
SAMPLE HITTERS SWING TENDENCY REPORT: The sample report below is called the Hitters Swing Tendency Report.
By reviewing this graphical report, coaches can determine dominant pitch type and location patterns based on swing result outcomes, which create a definite advantage for your pitcher.
In general, the swing patterns of hitters tend to be predictive based on pitch type and location, showing historically where the hitter has made good contact. Swing patterns also tend to be predictable on pitch counts where the hitter believes they will get a good pitch to hit. Below is a report that shows the swing patterns of a specific hitter on an opposing team. Count tendency reports can be printed in PDF format and taken into the dugout or shared with players, to prepare the hitters facing the opposing pitcher.
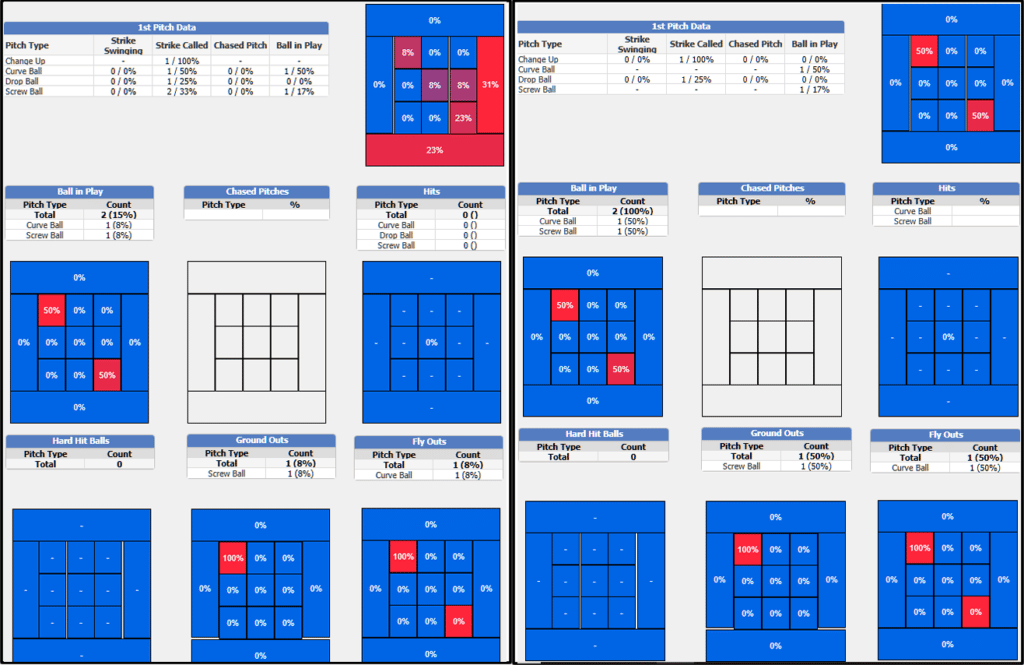
ANALYZING FIRST PITCH AGGRESSIVENESS: Some hitters are aggressive on the first pitch, thinking the pitcher will be throwing a good pitch that they can hit. This could be an area that we want to target. By selecting the first pitch graph (shown on the left screen below), we can see how aggressive the swing patterns are of the hitters. This hitter is not aggressive! She takes 85% of the pitches and only swings at the first pitch 15% of the time.
If this hitter were aggressive, the next step would be to determine if they make solid contact by getting hits or at least hit the ball hard. The coach can take the information to the next level by filtering when the hitter swings at the first pitch and puts the ball in play. This is illustrated in the screen shot on the right side of the diagram below. The report shows that even the two times this hitter swung on the first pitch, she grounded or flied out. We should throw first pitch strikes to this hitter and get ahead in the count. Just a reminder that when you are looking for these swing pattern tendencies, the more games you have charted on the opposing team, the more predictive the data becomes.
Count tendency reports can be printed in PDF format and taken into the dugout or shared with the player to prepare the hitters to face the opposing pitcher on their smart phones via email.
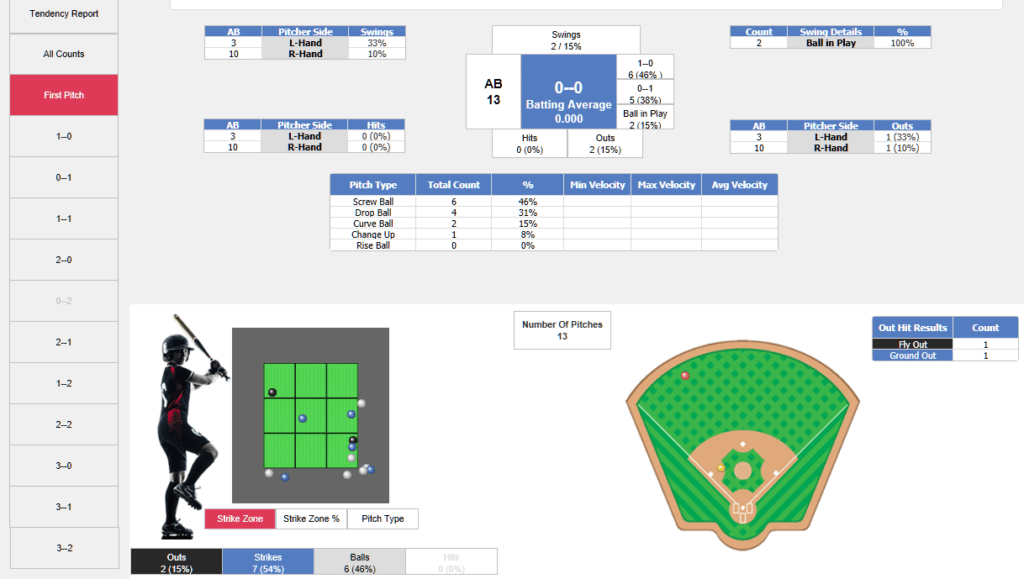
ADVANCED ANALYSIS OF HITTERS’ SWING PATTERN TENDENCIES IN COUNTS: For most game planning processes, as in the standard swing tendency reports described above, it is easier to interpret and identify the points to attack the opposing hitter. However, some coaches may want to see swing patterns based on different counts, other than just the first pitch. For those coaches, Dartfish has implemented an additional report called the Detailed Swing Tendencies on Counts Report.
This report provides unique graphical views into swing tendency patterns based on all counts and includes additional pitch pattern information. Both views are accessible from the main menu or accessed from either report.
For example, below is the Detailed Swing Tendency on Counts Report. This report looks at the same pitcher data, used in the previous example of the standard swing tendency report. The first pitch swing tendencies are shown in a different and unique format with additional pitch pattern information. All report information can be further filtered, based on pitch type, location or results.
To view multiple counts, the Detailed Pitch Count Report can be printed in PDF format. The report can be taken into the dugout or shared through email with your hitters.
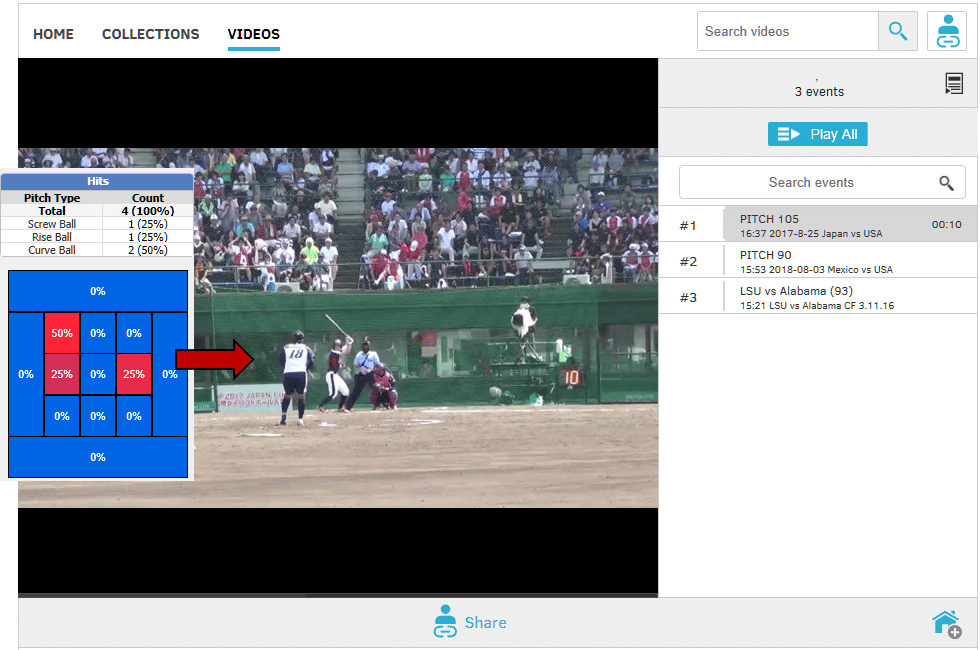
PREPARING YOUR PITCHERS TO FACE OPPONENT HITTERS: Both formats of the Swing Tendency Reports can be printed in PDF format and shared to the player’s email. Specific video of each pitch is filtered, based on the swing tendency reports. Dartfish calls this a smart playlist. This video playlist is shared with your pitchers to view in a team meeting or can be viewed on their mobile phones via email.
Below is a sample of a video playlist that was created by filtering the swing report on a specific opposing pitcher’s predominant pitch pattern. With one push of a button, the system creates the video playlist that can be viewed or shared with the hitters. The video playlist shows first pitch curve balls and rise balls thrown to a specific location 68% of the time. Preparing your players using our smart playlist is a very effective method of game preparation.
We hope that after reading this paper, you have seen the value that our baseball-softball products can provide for your program. For additional information, or a live (no obligation) product demonstration, please contact chuck.wilmot@dartfish.com
Comments are closed.