
One of the tasks that I set students in training to become Dartfish Certified Technologists is this:
Imagine meeting a coach in a bar. You get to chatting and when he finds out that you are a Dartfish Certified Technologist, he tells you that videos his players a bit, “Mostly to show them what they look like”. He wonders what he and his team could do better or quicker using Dartfish technologies. How would you answer him in 500 words or more?
How would you address this task? Clearly the objective is to reflect on the wide-ranging possibilities of Dartfish and be able to explain the interactions of software, apps and dartfish.tv in layman’s language. That’s a great way to learn any technical subject and, to be honest, as the pass bar isn’t set very high, many students do the bare minimum. However, yesterday I had an excellent submission from Antony Lee from Middlesex University’s Masters degree in Performance Analysis.
Before I go on, I should not pour favor on one particular student and this year I had several essays better than this, if only because his hypothetical coach may well have hypothetically shuffled off to another corner of the bar part way through Antony’s 2,800 word lecture. Nevertheless I liked the blend of features and benefits and in his words, “Given my background isn’t sports science, it certainly helped me solidify what the functionality was capable of. Once you go through and plan out all the themes, writing about their potential benefits doesn’t really fit into 500 words!“. You might use this article to supplement your own understanding. Let’s find out what he discovered. Along the way I have added my corrections and comments.
“Why should I use video analysis software?”
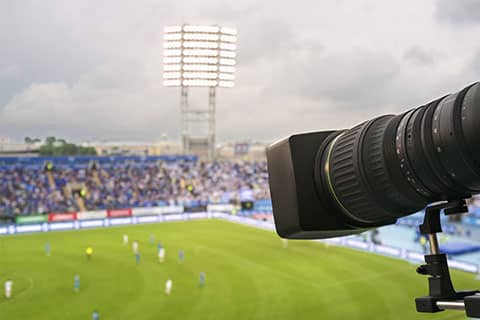
In a recent discussion with a football coach I mentioned that I was currently undergoing a training course in a video analysis suite called Dartfish. Although he sometimes showed his players videos of themselves, at the same time he seemed unsure of the additional that value that video analysis software could add. This note attempts to give him insight into the various functionalities of Dartfish and how they can be used to add value for coaches, players and other stakeholders.
It is well known in the performance analysis literature that a coach (or spectator for that matter) can only capture around 40% of information relating to game actions in a sport such as football. Additionally, processing of this information encounters a number of systematic biases that detract from the objectivity of a particular analysis, including own team bias (positive or negative), player favouritism (e.g. overlooking mistakes) and the halo effect. Factors such as speed of play, large numbers of actions and sub-optimal vantage point are often also an obstacle to the attempted hand notation of football games.
Hence, there is a requirement for a system that can aid in the capture of match footage and all its events to allow post match processing, editing and analysis. Dartfish allows the objective collection and presentation of the games actions, events and more microscopic player technique. Such a system when properly set up and integrated into a club’s processes can allow timely feedback to coaches and players as well as the development of longitudinal databases of appropriate performance metrics for both the profiling of individual players and team tactical evaluation.
- Dartfish provides a number of tools to evaluate a range of sports, where the nature of the events differ as does the required granularity of analysis:
- Team/Invasion Sports – fast moving; multiple events by multiple players; dynamic movement of player zonal positions as well as a ball; specific set piece techniques.
- Racket Sports – multiple shot types and positions; rapid player movement; variety of shot outcomes; specific shot technique.
- Individual Sports – Analysis of technique; monitoring of individual actions and outcomes; recording, timing and analysis of key phases.
In order for its application to encompass as many sporting performances as possible, the tools in Dartfish are bespoke in nature, allowing the user to configure the design of the capture of the events appropriate to the performance analysis question in hand. The software package can be neatly split into four categories whose functionality and benefits to a football coach will be discussed in turn:
- Video capture & uploading.
- Conducting technical analysis of a sports performance.
- Tagging of events emanating from a sports performance.
- Tools for the enablement of data collection and dissemination.
Video Capture & Uploading
The first stage in using any video analysis software is sourcing the footage that you wish to analyse. This can come in various forms including own recording of live footage, footage procured from opposition teams, archive footage from the internet or recorded television footage.
As technology evolves the capture of live footage is increasingly easy using either DV/HDV or tapeless camcorders, webcams, network cameras or even ipads/iphones. Dartfish supports the import and export of a number of ever improving video formats including MPEG 2/4 and windows media formats which allows seamless interaction between the software and the recording device via USB, Ethernet or Firewire.
Recording equipment set-up can be planned to optimize the material captured. A vantage point can be chosen sufficiently high above the touchline such that an adequate panorama of all action areas can be generated. Panning and zoom facilities of a recording device or manual manipulation (ipad…etc.) give additional flexibility in the capture of the action required. In other sports the additional possibility of attaching cameras to players, cars, boats…..etc. may provide supplemental insight over and above the traditional camera angles.
Once recording, there is not only the option of waiting until after the match to perform analysis but also to perform all or part of it live, so that video and statistics are available at half time or directly after match for optimal timing of feedback.
Once the video file is imported into Dartfish in the required format, the software provides a number of useful ways of managing this information. A typical club will collect and store a myriad of matches/performances and such a large database can quickly become unwieldy. Instead of relying on the (often disparate) structure of many users file folders/locations, Dartfish instead has the concept of categories and keywords that can be harmonised among users and made mandatory for all files in the database. For instance, a required category may be “Season” to which the keywords 20011, 2012, 2013…..etc. may be assigned. Other examples that may be useful in managing a team’s data include Sport, Opposition, Player, Venue (Home/Away). In this manner all video files may be stored in one file directory and the file management is handled internally by Dartfish which provides a pseudo data-basing solution. This functionality is also useful in the management of published files (via dartfish.tv; see later) where it also allows easier selection and management.
[Assessor comment: Keywords cannot be made mandatory within the software – only during upload to dartfish.tv. I like the way that the value of keyword management is explained here.]
Conducting Technical Analysis of a Sports Performance
Dartfish provides a module called the Analyzer which allows flexible editing of video footage and the production of focused analysis of key elements of a sports performance, allowing coaches to drill down to the essence of a performance:
- Edit and hone in on sections of video to produce observations not available to the naked eye due to timing or positional constraints.
- Allow objective feedback to coaches/players on technique and process
- Use as a tool to instruct as part of development life-cycle.
Once a clip is uploaded to the Analyzer (into a “Tray”, storing many clips in use, or directly to the playback screen), then the following tools are available to drive a range of analyses:
Extended playback functionality to allow efficient navigation around the clip
- Cue in/out
- Play head movement
- Playback speed adjustment (down to frame by frame to allow control and tease out fine detail)
- Zoom & move
- Looped or single play
- Volume controls
Splice selections from a video clip to a storyboard
- Cut out unwanted footage
- Only consider ball in-play time
- Produce highlights footage on a game or a player
- Focus on particular skills
- Storyboard selections can then be exported to a file for subsequent analysis
Capture key positions
- Identify and isolate key phases of a skill
- Compare between multiple examples of execution
- Annotate the videos using a range of tools (see below) to describe observations and measurements made
- Allow intra and inter player comparison, within or between matches
- Facilitate feedback for skill improvement or analysis of defects
Comparison studies
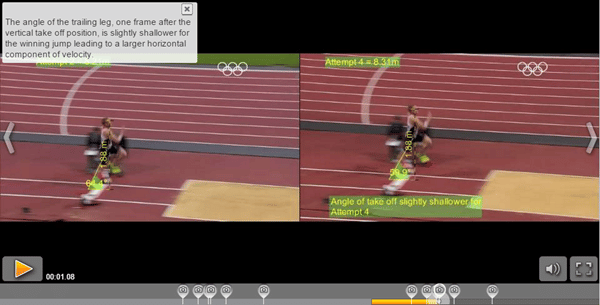
- Split the screen to compare the technique/positioning of players from up to 4 clips taken from a single or multiple videos (in football this may be penalty taking technique or defensive positioning from corner kicks…etc.)
- Synchronise the action in time in separate screens to exactly compare phases of a skill and annotate appropriately
- Annotate the videos using a range of tools (see below) to describe observations and measurements made on the clip
- Blend and merge the clips to allow even more accurate comparison of a number of instances of a technique
Available annotation tools allow both commentary and measurements to be added to the video, a storyboard item or a key position and faded in and out during playback of feedback to aid the understanding by the player/coach. Text commentary can be added to describe the nature and quality/deficiency of a technique. Angles and distances can be measured and displayed, where distances can be calibrated to a known reference, and positional references can be monitored through time (“splines”) to allow calculation of appropriate x-y positions, distances and velocities (e.g. the speed and trajectory of a free kick). Splines can then be linked to data tables for presentation or export and subsequent statistical analysis. Additionally, images from external sources can be imported to further enhance the analysis.
For example, a goalkeepers positioning and movement during free kick set pieces can be analysed to better understand and optimize initial position, wall organisation and nature and timing of movement against outcomes. The annotated storyboards or key positions can then be exported in a media book format to tell the story of your analysis or as a movie file for subsequent analysis and manipulation. Such analyses can form the basis of an ongoing performance analysis database.
Tagging of Events Emanating from a Sports Performance
In fast moving and team sports, it is often impossible to discern all of the important occurring events/actions with the eye, or even record them using hand notation or a simple computer spreadsheet. Hence video analysis software provides a medium by which actions conducted on the field of play can be recorded and easily logged both live (to give immediate feedback) or after the match. Additionally, post-match, events tagged during a match can be replayed and additional keyword information (or “event attributes”) can be added to describe the event and provide a richer context for analysis. For example, a “goal attempt” event may be later appended with keywords such as attemptor, attempt zone, assistor, assist zone, outcome and length of possession depending on the focus of the required analysis.
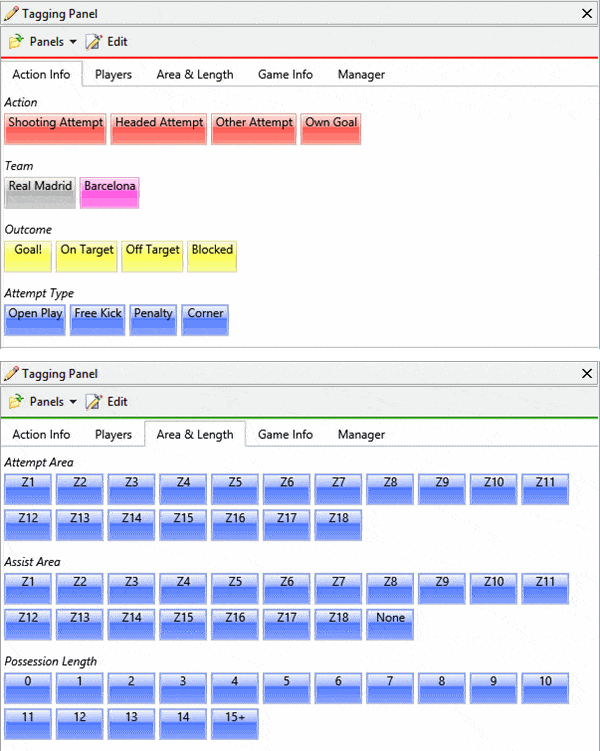
The tagging environment comprises four integrated elements:
- The playback screen – live action or a video clip is shown where the playback speed can again be controlled in the latter case, to say 2X or 0.5X to optimize the post-match analysis process
- The tagging panel – a bespoke panel of buttons designed by the user to address the particular performance analysis needs
- The events list – a list of all events recorded as part of the tagging of the loaded video clip
- The library – the database of available video files.
Tagging panels are not specific to a video clip and can be created, saved as a file and reused or shared. In this way templates can be created for use, say, on match days, post-match or in training.
The design of a tagging panel allows the inclusion of buttons to record specific events/actions during a video via the press of an on screen button on the panel, followed by subsequent clicking of keyword buttons to add context to the event. If there is not time to add all keywords before the next action occurs then these can be added later. Pressing an event button not only produces a recording of the event but also records the event in the events list (see below). Recording duration and pre-roll for each action button can be set to give an appropriate recording window for the event analysed so as to capture the relevant action (e.g. a conditional event where we wish to monitor the precursors to a later observed event can be set with a significant pre-roll). Alternative continuous event buttons can also be configured which need to be pressed on/off at the start/end of the event.
[Assessor comment: Creating an event doesn’t create a recording, it marks and describes a segment of video in a video file. It is possible to export events as multiple individual files. But the starting point is to work with a single file]
The layout of the panel is bespoke and flexible and can be designed to allow maximal recording of information in the available timeframe. The user decides the events to record and hence the outputs are not limited to just on the ball events as in many commercial databases.
Once the actions and their attributes (keywords) have been decided upon, the layout of the tagging panel can be configured. A hierarchical structure can be adopted via the use of tabbed group boxes which brings the most important buttons to the front and avoids cluttering (both physically and psychologically!). This structure is further informed by which information one needs to record live/first pass and which is to be added later. Such flexibility allows optimal design in a fast moving, multi-event sport such as football. Set up of triggering between tabs allows additional efficiency to be built in that sets off automatic chained movement between tabs such as:
ACTION -> KEYWORD1-> KEYWORD2->ACTION
Persistent keywords can also be set up which are appended to each recorded action as they are created. These may be used to record and analyse effects such as actions per time slice (0-15 mins, 15-30 mins, 1st/2nd half…etc.) or as a function of game state/score line.
The final tool to discuss that provides benefits in the tagging panel is the team manager which allows creation of player databases for reuse during a season to save keying time and allow squad selection. The manager tool is then linked into keyword buttons on the tagging panel representing the selected players, which can be adjusted for different games or due to substitutions during the game. The setup of the team manager also allows a player’s team to be recorded whenever the player keyword button is pressed, another useful facility saving an additional click.
After a video has been tagged, all the recorded events are shown as a row in the event window, in a similar manner to data in a spreadsheet. Each event contains:
- Action name
- Position and duration of the clip
- Any keywords added in their appropriate category column (e.g. Player, Outcome, Zone)
- Persistent keywords (half, score)
- Other texts fields set up that are useful for databasing (season, venue, opposition)
The event list can be sorted by column or filtered by keyword, to say isolate just a particular players events. This is particularly useful when compiling highlights movies to provide performance feedback in a particular game or across a string of games. Events can be edited to add fields or eliminate errors, either manually by clicking the appropriate row/cell or by playing the recorded event clip and clicking tagging buttons. In this manner post match tagging is made quick and easy also.
Each action/event is stored as a video clip which can be chronologically played, edited (e.g. to make longer/shorter) or used to create a highlights movie.
[Comment: as per the last comment, each event is not a separate video clip but a marked section of a single video of the entire game. The events list can therefore be thought of as an index of actions within the match]
While the data format of the events list is akin to an amenable well known form (i.e. a spreadsheet) the manipulation of the collected data also follows a similar path. Simple statistics can be compiled from the data using a ‘pivot table’ like feature which allows a dice and slice of the frequency of each action/keyword. For example, I could ascertain how many successful passes my no.10 made in Zone 14 in the second half and compare that to the opposition’s no.10. The tables additionally allow one to click on their elements and isolate and play only the video clips of passes from the aforementioned no.10. Event data can additionally be exported to Excel to allow a myriad of alternative manipulations and statistical analyses.
The tagging module provides extensive infrastructure to conduct structured, repeatable match analysis which can generate many outputs that feed into the coaching life cycle such as match storyboards, player highlights movies, various statistical summaries, longitudinal database source information and tactical presentations.
Tools for the enablement of data collection and dissemination
Although video analysis software is a powerful tool, it may not be the optimal medium to collect or share data in certain circumstances, where time or space are at a premium or centralised databases need to be appended, maintained and shared with all. In order to enhance the analysis experience there are a number of peripheral applications that make life easier in these situations which are briefly described below.
Dartfish Note – Available for use on the iphone/ipad, Note is an app that allows the creation of simple tagging panels that can be used where conditions are not conducive to laptop use (e.g. some training situations, away fixtures, academy football, scouting…etc.). Set up of tagging panels is simple with touchscreen recording of events and keywords and event information can be imported into Dartfish and the timeline coalesced with parallel video recording (if available).
Dartfish Express – This app is an iphone/ipad enabled version of the Analyser for mobile live recording of technical performances. It contains a subset of the tools available in the Analyser for annotation of technical performance video.
Dartfish.tv – Creation of video and data is only a first step and dartfish.tv provides a conduit for the storage, organisation and sharing with athletes and coaches and other stakeholders. It allows channels to be set up, with ownership and access rights; where channel members can publish their work (a certain user’s work being allocated to their own “collection” within a channel). It provides a secure repository for the development of a structured database of collected performance information. Coaches can therefore arrange their tactical information and also publish appropriate analysis to each player’s channel to form the basis of one-on-one evaluations. The categories/keywords used in the Dartfish library are replicated here to give additional structure and search facilities within a channel.
Conclusions
The applications of Dartfish are flexible and varied, but giving the functional power to the user as described above allows performance analysis information to be easily integrated into a clubs existing coaching framework without the use of complex programming languages or difficult to use interfaces. Hence, the nature of the analysis can be configured to be maximally appropriate to the institution, as well as easy to digest on a number of levels from analyst to player to manager.
[Comment: So what would you have added? What did Antony leave out which is a priority for you? I’d like to highlight concept of efficiency; the fact that many of the tasks mentioned might be done in other ways with other tools but it would take so much time as to be impossible for the ordinary time-pressed coach or analyst]
My thanks to Antony Lee for giving permission to share this.
Comments are closed.