
Here is a tip for Dartfish power users. It was sparked by this question….
“I’d like to display the current score on the video. I could add scores as text drawings and fade them in and out as required, but is there a quicker way? – Zak Saucede, Dartfish Certified Technologist.
There sure is! You can use Dartfish Tagging to mark up the video with the score at different periods of the game, export the data then link the imported file to the video using Dartfish’s CSV data reader.
Before getting down to specifics, let me ‘kill two birds with one stone’ by fully explaining the powers that Dartfish has to use data from other software and hardware.
Using data from other software
There are many sport-specific stats tools. That specificity can be a bonus, making use of these preferable to doing the same job with a Dartfish tagging panel. However, they may lack video or other benefits of using Dartfish; for example, producing searchable tagged video on dartfish.tv.
So get the best of both. Provided that the other software has a feature which exports its data to a CSV file and there is something in the data which corresponds to a start time and duration for each event, it is highly likely that you can import it without further manipulation. This video explains how to import Easytag App data but in fact is applicable to any CSV file import.
Using data from Amisco (Prozone), Sportcode, Opta and Bstats
But what if the data isn’t so cooperative? Dartfish 7 provides specific importers from some of the sport world’s data big hitters. These importers manipulate the data into a form which can be used by Dartfish. They are installed as add-ins to your software via the Dartfish Options (Tools > Options menu) and are then found as choices on the Events List Import/Export button
Linking data to video
Aside from match analysis, there is another way in which you may wish to use data with video and that is to view both simultaneously. In doing so you can visually assess what was happening in the performance that produced the reading from your accelerometer, GPS tracker, heart rate monitor, power meter…etc.
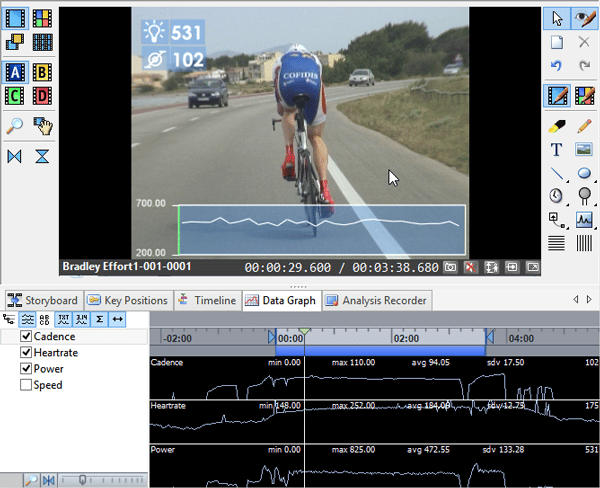
Dartfish displays data in its Datagraph feature or as a video overlay of numbers and graphs – both of which are illustrated below.
Again, your device’s accompanying software must produce, or be able to export, a text file containing the data. Often it will have some kind of export tool which strip out any additional information that is required by the device but of no interest to you. If not, this could be done manually. The bottom line is that the first row of the file must contain the data that you are interested in.
This time the data isn’t imported into Dartfish. Instead, a Dartfish Data Reader links the video and the file. Dartfish provides readers for SRM power crank .srm files and a generic CSV file reader. We have also produced other readers for national teams but these are not commercially available.
Let’s now stamp the last bit of metaphorical life out of this first bird by mentioning that it’s also possible to simultaneously record data and video LIVE! For example, Smartspeed timing gate data can be instantly displayed on video as it is recorded so that the biomechanics of sprinting can be related to the speeds produced. This requires a software ‘bridge’ to be created to intercept, translate and incorporate data with video. Bridges exist for certain products such as Smartspeed and we can assist programmers to create their own.
There is a tutorial which elaborates on all these data features. You can find it here
And now for that second ‘bird’!
The problem that was posed at the beginning of this article requires a combination of two things we have learned so far. Except that this time, the data is exported from, not imported to a Tagging events list and video is then linked by the CSV Data Reader.
I created a tagging panel which recorded the score at different periods of the game using an event button and a score panel. Your event could be anything; I’ve used an artificial event called ‘score change’ but if you wanted to incorporate this into other match tagging you could use any other event which starts immediately after the score change. Remember that only the time stamp (position) of each event is important – duration is not used or understood by a data reader. The panel that I used and the data it produced are illustrated below.
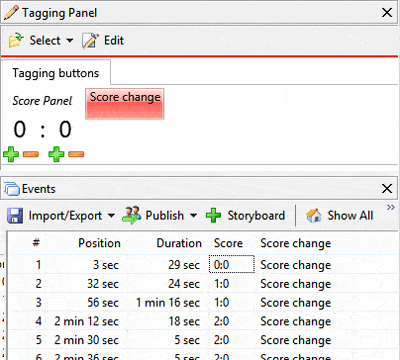
Next, ensure your data remains sorted into time order (the default) and export the events as a CSV file. Quickly and simply done using the Import/Export button on the Events List toolbar.
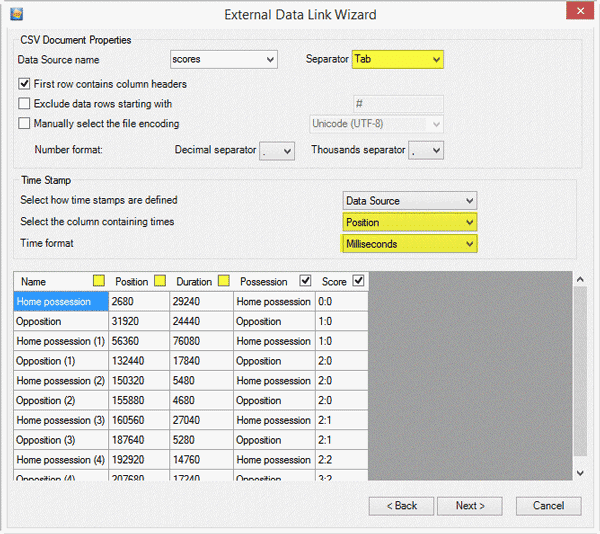
Now that file can be linked to the game video. Again, this is done quickly and simply by right clicking the file in the Library and choosing the option Link External Data…
The importer is very versatile, with a lot of choices for different types of data, so to simplify those, here are the time stamp and separator choices you’ll make for data exported from a Dartfish events list (highlighted):
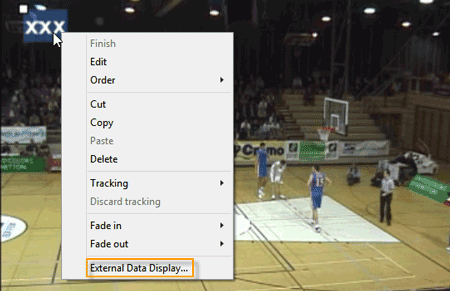
To display the score you’ll first add a text drawing, right-click it then choose a data stream to display. A useful tip being to type anything into the text box to make it easier to right-click.
Voilá!
Specialist data importers such as those for Sportscode, Opta and BStat are available for all Dartfish editions which have Tagging functionality. Only Dartfish 6 and Dartfish 7 TeamPro Data edition include Data Readers. Readers were also available for Dartfish 5.x as an additional purchase. Thanks to Zak Saucede for inspiring this week’s blog. No birds were harmed in the creation of this article.
Comments are closed.