
A Coach Dart series
Over the last three years, Dartfish has developed a toolset that increases your coaching efficiency in developing your hitter’s skillset. In this article we will discuss the use of the toolset.
STEP 1: Electronic Charting of Games or Practice
Generating pitcher or hitter information for both focus areas, requires that a staff member use our electronic charting tools to chart pitches in a game or practice. The staff member watches the game/practice live or from video files. For each pitch, they press software buttons that identify when the pitch occurs and its results. The charted data is exported to our cloud service where graphical player reports and videos are available to coaching staff and to players anytime, anywhere on both computer and mobile platforms.
STEP 2: Looking for Player Trends
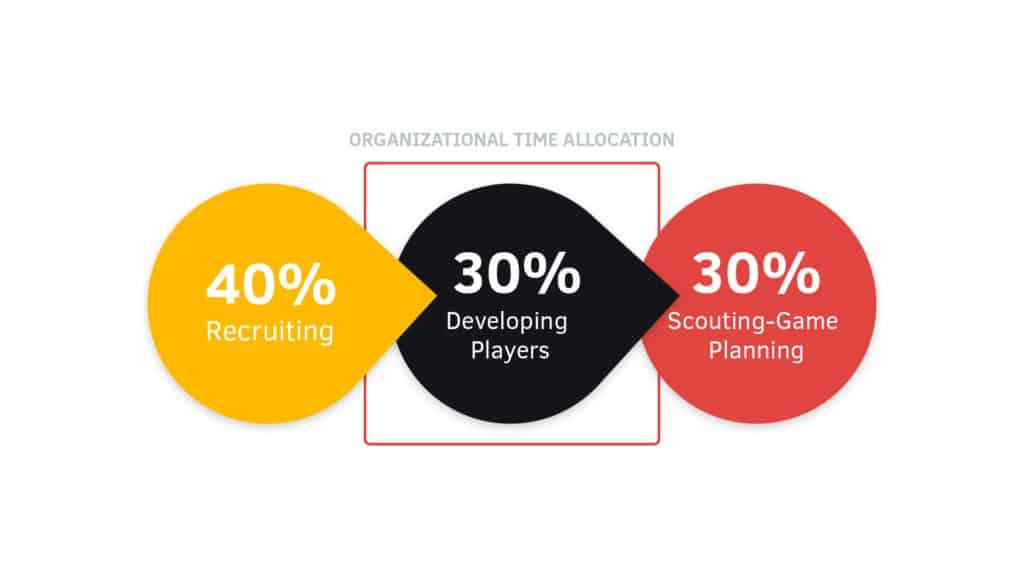
INCREASING PLAYER DEVELOPMENT EFFICIENCY: The technology breakthrough of this toolset is within our graphical data visualization reports and our ability to integrate them with pitch video. The reports are not your standard statistical reports. They are easy to interpret graphical player information reports that identify for coaches, the strengths and weaknesses of each of their players. By using these reports, coaches can identify specific improvement areas for each pitcher and hitter on the team and implement specific improvement areas for specific players in practice.
Efficiency is improved with use of video as a visual teaching aid. The ability to search and share access to the correct pitch video is key to improving a coach’s efficiency. Dartfish has integrated its graphical data visualization reports into its video sharing platform, allowing coaches to identify teaching areas. These specific video playlists can be shared with players who can view their video anytime, anywhere on their smartphones.
Let’s first walk through an example of the use of our data visualization tools. We will analyze a pitcher’s information and setup a player improvement plan. Note: The reports support both Baseball and Softball player reports. The major difference is in pitch type and player photos. In this article, we will alternate the baseball and softball reports.
When we start analyzing a pitcher’s performance trends, we want to look at as many pitches as possible. To navigate easily through the report, you will see what we call key performance indicator buttons. They are located on the left side of the report, allowing you to filter the pitcher’s data looking at specific metric using visual data representation. Let’s select “All Pitches”. As we take a quick look at this information, it shows us that this pitcher does not overpower hitters, striking out less than 10% of the hitters faced. The pitcher relies on hitters not making solid contact.
To determine how we can improve this pitcher’s skills, we need to determine what happens when hitters get on base. We can do this by a filter selection in the report, allowing us to see the pitches when HITS occur. By selecting the Hits button on the left side of the report, it filters all the pitch data when hits occur.
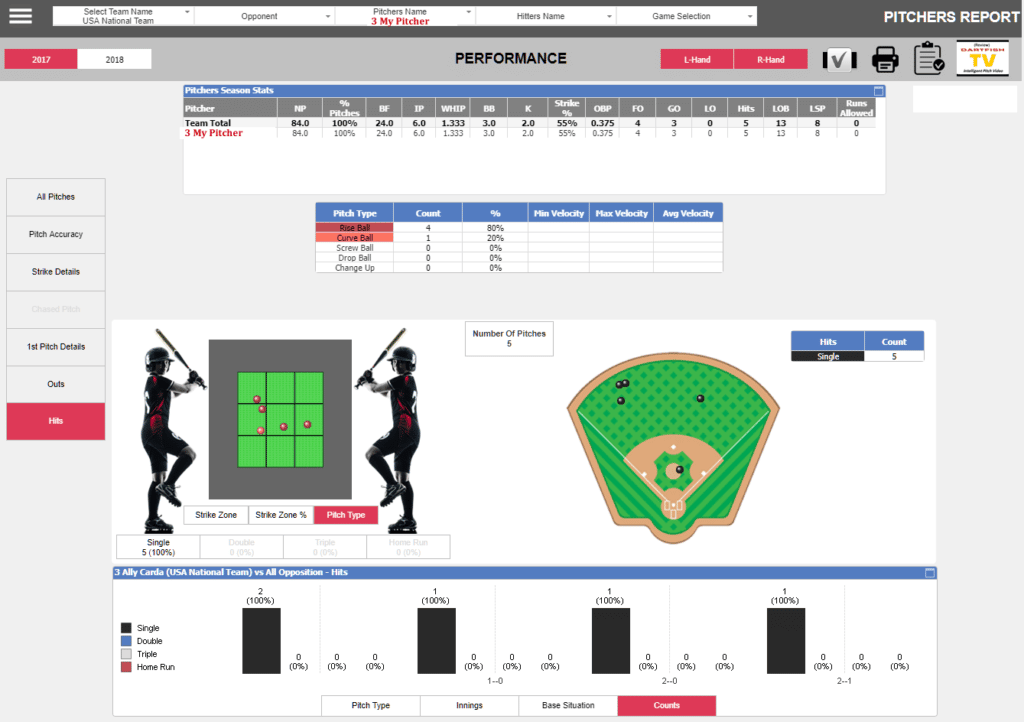
When hits occur, the pitcher is throwing pitches over the middle of the strike zone, resulting in successful hits by the batter. We could also filter on the hitter’s side, if we wanted to determine if the pitcher throws differently to right-handed or left-handed hitters. With this pitcher it does not make any difference.
So, we now know the pitcher is giving hitters too many opportunities to hit the ball when these pitches are over the middle of the plate. Let’s look at what pitch type and on what count this occurs. By using these two simple steps, we can identify an area of improvement for this pitcher. We can see that the pitcher’s “go to” pitches are the RISE BALL AND CURVE BALL. The pitcher uses these pitch types on first pitches or when s/he gets behind in the count. To improve this pitcher’s skills, we will work on some accuracy drills on these pitch types in bullpens. We will work on repetitive drill scripts that will improve the pitcher’s accuracy while removing pitches over the middle of the plate. These focused accuracy drills should also increase the pitcher’s strike percentage and even increase the possibility of hitters chasing more pitches.
STEP 3: Teaching Through Video
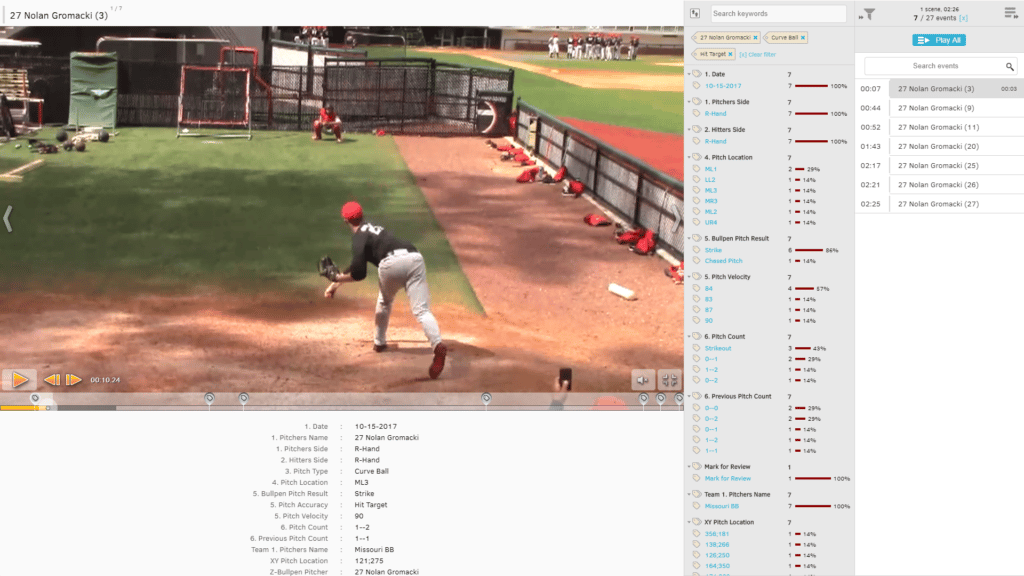
To start the visual teaching process, we should provide video to this pitcher, showing the problem area. The toolset provides an easy to use interface to share this specific video with the player. Simply Click on the paper clip ICON on the top right of the screen. The system will take you to your online video sharing platform where you will select the pitches that result in hits.
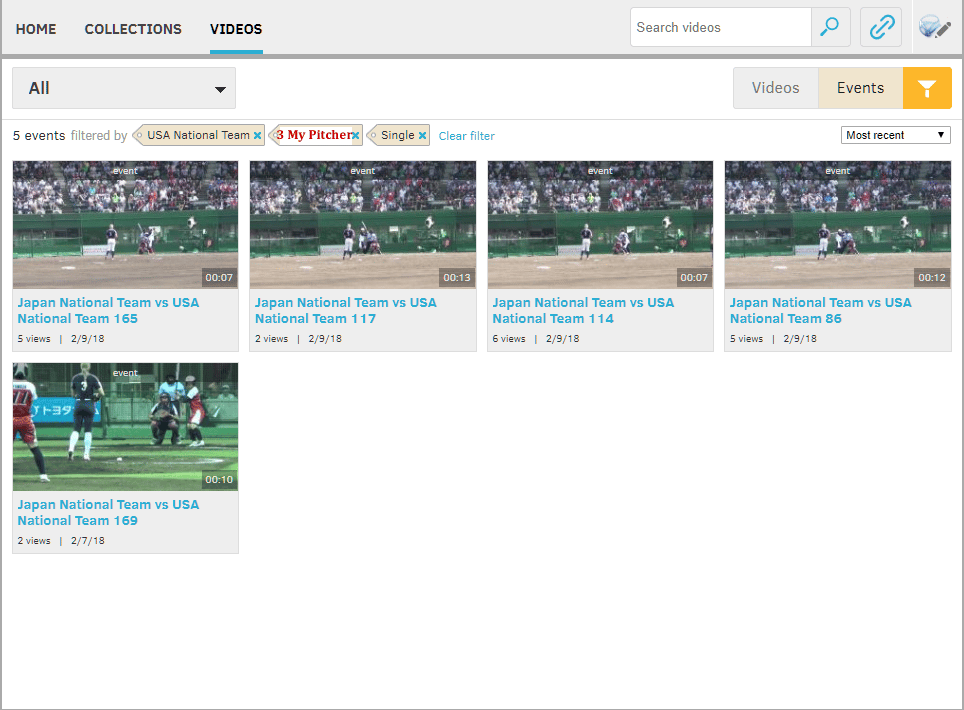
After you select the paper clip ICON, a menu will appear allowing you to share with the pitcher via email or text messaging, your specifically selected video pitches, filtered from the visual data reports.
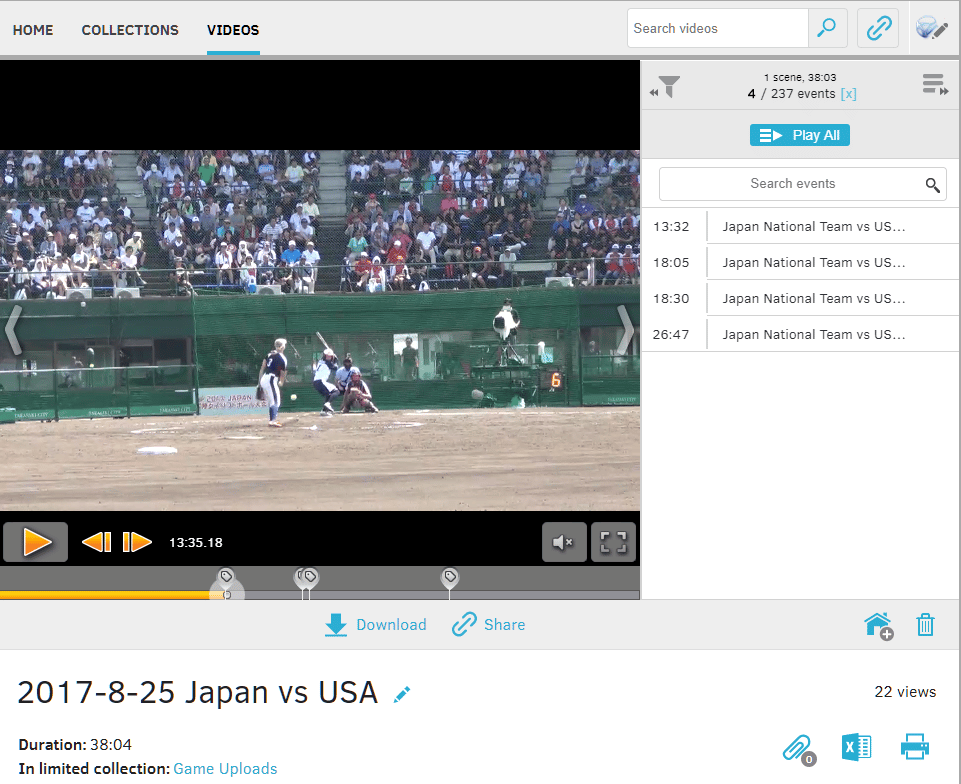
Here are the results of the coach sharing specifically selected video pitches with the player. The video can be played and reviewed as many times as the player requires, using a mobile device with no external software installed.
STEP 4: Executing the Development Plan
This process is similar to game charting and analysis. However, this time the pitching coach has a written bullpen script that addresses the problem identified for the pitcher from the visual data reports. Staff members chart the bullpen, either as it is happening or afterward from the video. Below is the report from the bullpen.
Below is also a copy of a baseball pitcher executing a bullpen script. It would be the same for a softball pitcher, except the pitch types would be different and the report would show softball hitters instead of baseball hitters.
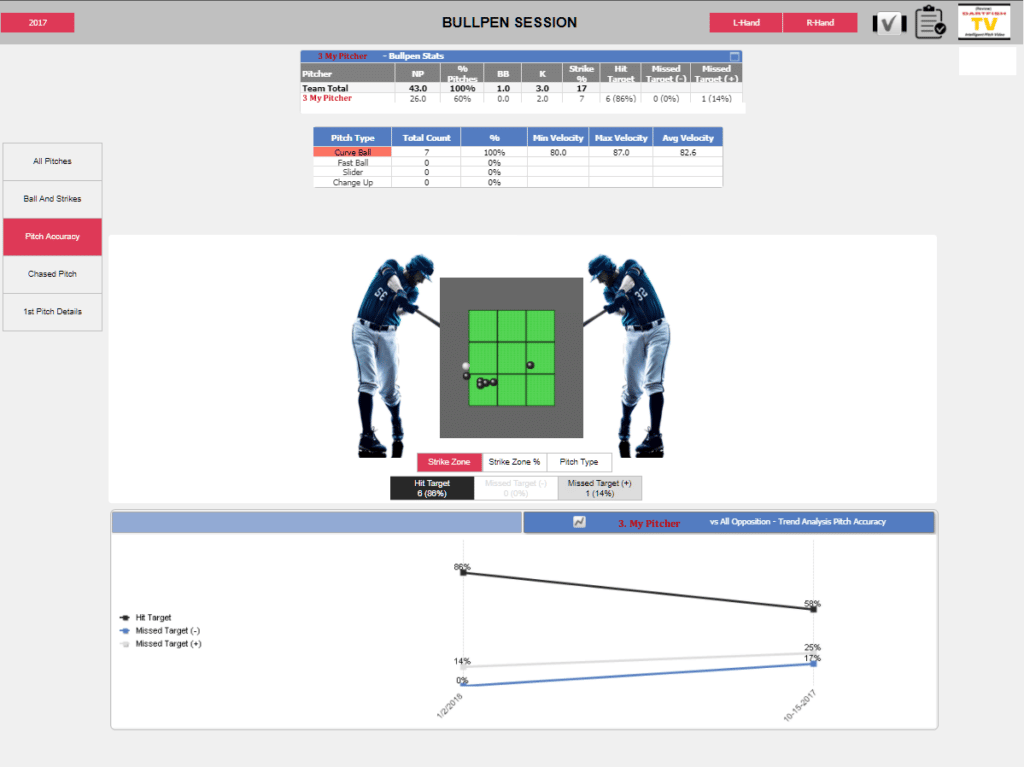
We have based the visual data reports on bullpen type metrics. In this example, we wanted to work on the pitching accuracy to eliminate the pitches over the middle of the plate that were being thrown on the first pitch or when the pitcher was behind in the count. The pitching script would place the pitcher in this scenario. The results of the session would be measured to determine the pitcher’s effectiveness. Multiple sessions could be checked by selecting the trends option at the bottom of the visual data report. See the red box at the bottom. In this example, we are measuring and displaying the pitcher executing the bullpen script across multiple bullpen sessions.
TEACHING THROUGH VIDEO: We can duplicate the video sharing process as we did previously. This time we will be reviewing the pitches thrown in the bullpen vs the game. We again create the video playlist from the visual data reports and share that with the bullpen pitcher. The pitcher could review this with the pitching coach or on his/her own through a smart phone.
Article Summary:
If you believe that developing a winning team requires technology tools that can improve your efficiency and deliver results, then contact Dartfish for a live demonstration of this toolset. Dartfish has created product bundles for ALL BUDGETS.
Please contact Chuck Wilmot for a live online demonstration.
Read the other “Coach Dart series” articles
Comments are closed.