
A Coach Dart series
Over the last three years, Dartfish has developed a toolset that increases your coaching efficiency in developing your hitter’s skillset. In this article we will discuss the use of the toolset.
STEP 1: Electronic Charting of Games or Practice
Generating Hitter or hitter information for both focus areas, requires that a staff member use our electronic charting tools to chart pitches in a game or practice. The staff member watches the game/practice live or from video files. For each pitch, they press software buttons that identify when the pitch occurs and its results. The charted data is exported to our cloud service where graphical player reports, and videos are available to coaching staff and to players – anytime, anywhere on both computers and mobile platforms.
STEP 2: Looking for Player Trends
INCREASING PLAYER DEVELOPMENT EFFICIENCY: The technology breakthrough of this toolset is within our graphical data visualization reports and our ability to integrate them with pitch video. The reports are not your standard statistical reports. They are easy to interpret graphical player information reports that identify for coaches, the strengths and weaknesses of each of their players. By using these reports, coaches can identify specific improvement areas for each pitcher and hitter on the team and implement specific improvement areas for specific players in practice.
Efficiency is improved with use of video as a visual teaching aid. The ability to search and share access to the correct pitch video is key to improving a coach’s efficiency. Dartfish has integrated its graphical data visualization reports into its video sharing platform, allowing coaches to identify teaching areas. These specific video playlists can be shared with players who can view their video anytime, anywhere on their smartphones.
Let’s first walk through an example:We will analyze a hitter’s performance using the toolset and set up a player improvement plan. Note: The visual data reports support both Baseball and Softball player reports. The major difference is in pitch type and the use baseball or softball player icons in the reports.
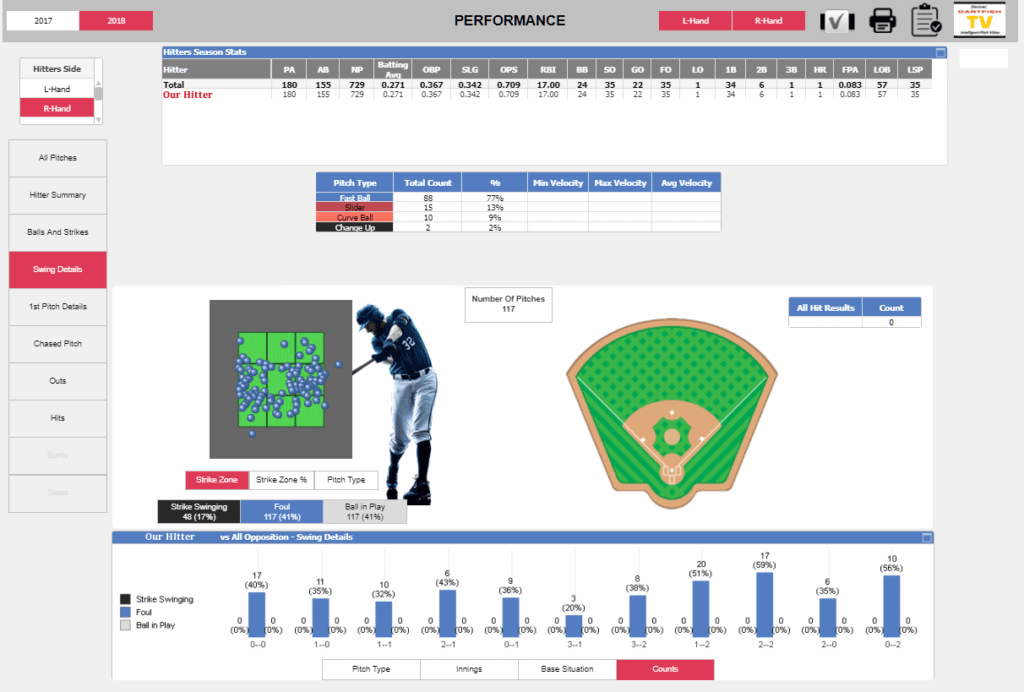
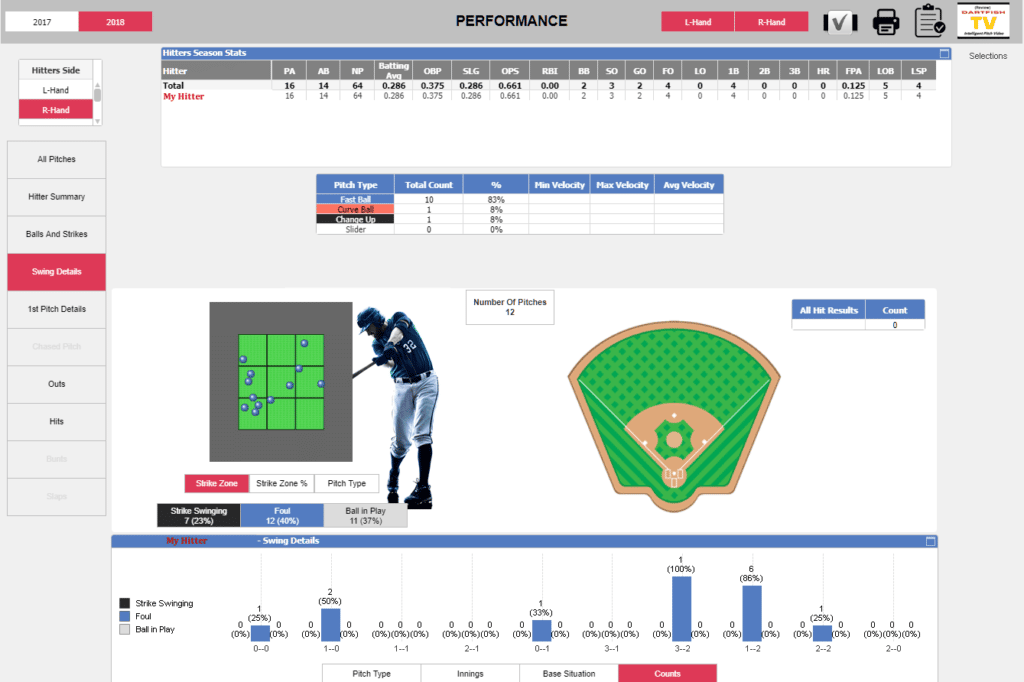
When we start analyzing a hitter’s performance, some metrics to initially look at are: batting average, OBP’s, Slugging percentage and RBI’s generated to determine if they are a clutch hitter. However, that does not tell us a hitter’s trends and tendencies or what we can do to make this hitter better. To do this we need to take a deeper look into our visual data reports.The first place to analyze a hitter’s performance is to look at how aggressive the hitter is at swinging at strikes. We can see from the seasonal stats that this hitter has walked only 14% of their plate appearances. We can also see that the ratio from SO/Walks is 143% and determine the strikes taken/strikes swinging foul balls + balls in play ratio. All of this information is available on the hitter performance report. We can quickly see that this hitter does not have a problem swinging at pitches in the strike zone.Let’s move to the next step and determine what happens when the hitter swings at pitches. Select the button on the Key Performance Indicators ͞Swing Details͟. As we take a quick look at this information, using the report we can see a big area of concern.This hitter is not making good contact with the ball. After 282 swings the hitter has only put 117 balls into play. This represents only 41% of the hitter’s swings making contact. And as Coach Dart would say ͞We all know that isn’t good.͟We could filter the foul balls based on count to determine if the hitter is fouling off pitches when protecting the plate. We see that 38% of the foul balls occur when the hitter has two strikes. We don’t want to be too critical of a hitter protecting the plate. However, in this case the hitter is still having problems making solid contact with all counts. To really point this out to the hitter, we will filter the hitter’s data on belt high pitch locations.
STEP 3: Teaching Through Video
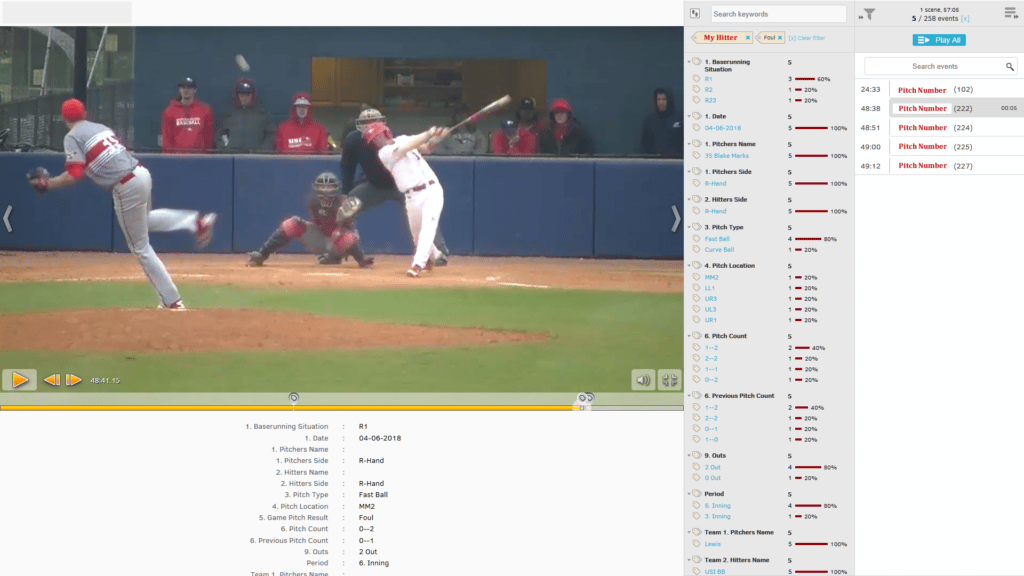
To start the visual teaching process, we should provide video to this hitter, showing the problem area. The toolset provides an easy to use interface to share this specific video with the player. Visual teaching is a powerful toolset. The enhancement of the Dartfish toolset is to review the pitch video based on information in the visual data reports. To accomplish this Dartfish has integrated pitch video into our reports. For example, let’s choose a recent game to show the hitter this specific problem.
Again, this recent game again shows the area of focus for this hitter. To visually review the area that we will be working on with this hitter we will share the pitch video with the player by clicking on the Dartfish TV logo that is listed top right above the arrow. Below is the video playlist, generated by the visual data reports.
The coaches can choose to bring the hitter into the baseball-softball office to review the generated playlist with the player or share this video playlist, so the player can review online. Simply Click on the PAPER CLIP ICON at the top right of the screen.
A menu will appear allowing you to share with the hitter via email or text messaging, the specifically selected video pitches, filtered from the visual data reports. The player will be able to review the pitch video of all the foul balls generated by the hitter on their computer or mobile device. Using this method of review, the player will be motivated to spend time in practice sessions working on drills that improve the hitter’s skills to make better contact.
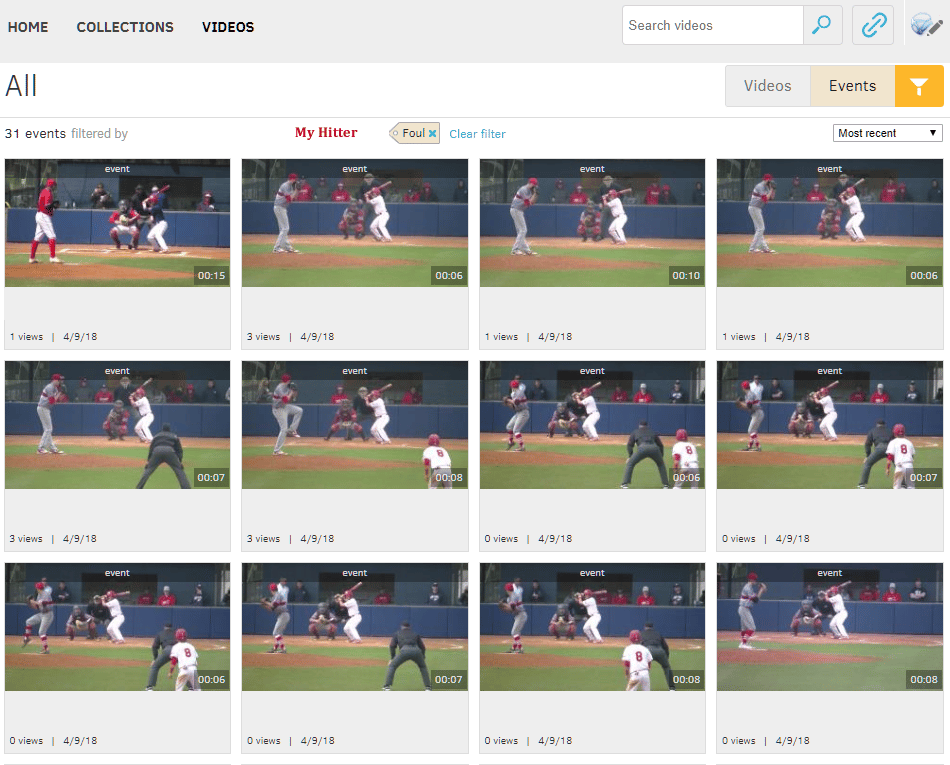
Here are the results of the coach sharing specifically selected video pitches with the player. The video playlist can be played and reviewed as many times as the player requires, using a mobile device with no external software installed.
STEP 4: Executing the Development Plan
There can be several causes for not making good contact. One is not seeing the ball (Glasses or Contacts required). Another could be the hitter may have some biomechanics flaw in the swing process. There does not appear to be a bad decision process since the hitter is not chasing bad pitches or is having problems with specific pitch type or location. The hitter is not making good contact as shown above with all pitch types even those thrown belt high where good contact should be made.
The first problem area needs to be corrected by an eye doctor; the second can be analyzed with the swing coach or hitting coach. A tremendous value of the Dartfish Toolset is having the ability to filter and review just the pitches from the game that you select to use for teaching. Within the Dartfish, software we have downloaded the game and charting data from your Dartfish TV channel. We have filtered the pitch video based on the hitter and all the pitches that were swung on and missed or fouled off
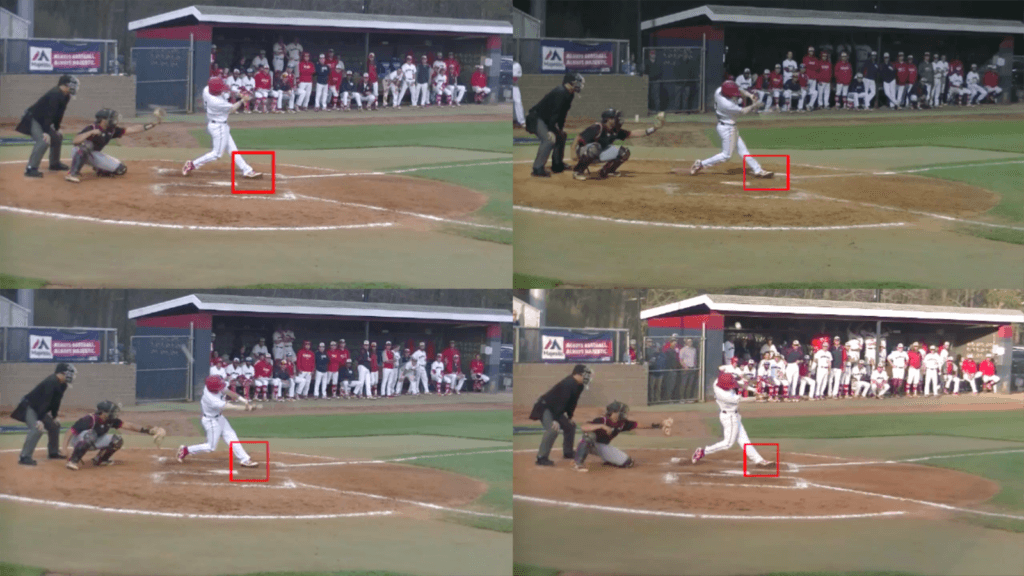
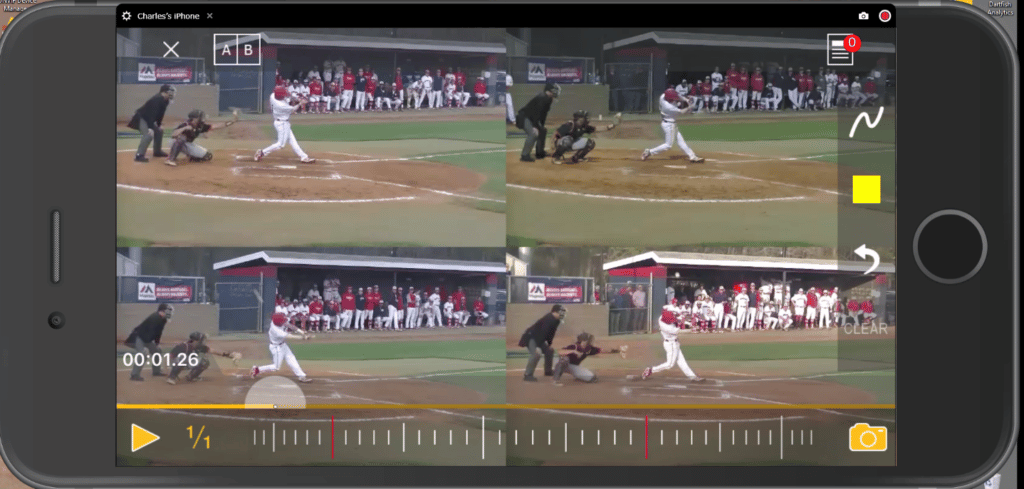
From this analysis, you can see that the hitter’s left side is collapsing. When this happens the tendency of the bat barrel is to drop. On outside pitches especially, the hitter either misses the pitch or fouls the pitch off. We need to work on drills, especially on the outside of the plate, working on going with the pitch and not collapsing on the left side. The teaching video can be shared with the hitter and viewed either in the baseball/softball offices with the coach or online through the player’s mobile phone. Below shows the video as played on the hitter’s mobile phone.
STEP 5: Evaluate your hitter’s improvements
he next step would be to determine what improvement is taking place with this hitter. We can monitor that through repeating the process in LIVE-BP where it is easier to control the pitch type and pitch locations to the hitter. We chart the practice and evaluate the visual data reports and track trends, swings, misses, and foul balls in multiple practice sessions. The trend reports in the hitting practice reports will show us if the hitter is improving. Below is a sample report of Live-BP sessions showing you the trend reporting on a hitter.
TEACHING THROUGH VIDEO: We can duplicate the video sharing process as we did previously. This time we will be reviewing the pitches thrown to the hitter in Live-BP sessions. We again create the video playlist from the visual data reports and share that with the hitter. The hitter could review this with the hitting coach through a live session in the office or the hitter could view this video on his/her own through a smart phone.
Article Summary:
If you believe that developing a winning team requires technology tools that can improve your efficiency and deliver results, then contact Dartfish for a live demonstration of this toolset. Dartfish has created product bundles for ALL BUDGETS.
Please contact Chuck Wilmot for a live online demonstration.
Read the other “Coach Dart series” articles
Comments are closed.