
In this article by Pete Leno from AccuPower, he explains why they teamed up with Dartfish to bring visualization tools to force plate data and gives two examples illustrating the simplicity and effectiveness of the approach.
The learning styles of today’s students are certainly more visual and hands on, so to effectively teach biomechanics requires that teachers are equipped with the tools to provide that hands on approach to teaching. To this end, AccuPower Software and Dartfish have collaborated to seamlessly integrate 3-D force plate measurements with digital video analysis, providing educators with a robust teaching tool for labs and classrooms. The resulting integration of kinetic data and Dartfish video analysis visualizes the scientific principles behind human movement in a time and cost effective manner.
AccuPower Software 2.0 is a software package that integrates data collection and analysis from any AMTI force plate with Dartfish video analysis software. Data streams collected by AccuPower Software can be displayed in Dartfish and integrated with video in real time, offering a seamless, visual solution for analyzing athlete performance.
AccuPower Software and Dartfish function as an integrated unit to make the collection of data and video a very easy process. AccuPower Software will direct the functions of data collection, video capture commands, and the streaming of data to Dartfish.
Because this is a real-time process, within seconds of the recording the students are engaged in analysis and discussion using a video clip that has the data overlaid on it. This allows students to integrate quantitative 3D force plate data with 2D HD color video when analyzing human movement. This solution provides the ability to synchronize data and video using graphs, text boxes, or force vector diagrams, so your students can interpret and validate data by creating a kinetic and kinematic interface.
Thus, educators and students will spend MUCH MORE TIME with analysis and discussion and MUCH LESS TIME with data collection processes. No more using valuable teaching and learning time to piece together an analysis.
Example: Integration of data an video to quantify and visualize force vectors
Here, students are provided with a means of visually understanding ground reaction forces using Dartfish to display forces sent from AccuPower Software. In a lab of this kind using Dartfish, we will display (1) Normal GRF, (2) Resultant friction force, and (3) overall resultant force for a single long jump test.
The significance of ground reaction force is that it represents forces acting on the body’s center of mass that will result in a change in its movement. The magnitude and direction of the CoM movement is a reflection of all forces acting on the object.
The Dartfish Force Meter is an overlaid diagram which allows you to bring the resultant force vector to life. ‘Draw’ the Force Meter directly underneath the subject shown on the live video stream, link it to the Accupower data source, record the action with your Force Meter in place and then immediately you will see the resultant force vector displayed in real time. Better still, video recordings will automatically replay in a loop and in slow motion if desired. The force vector will originate from the center of pressure and will be directed through the subject’s center of mass. As with any force vector display, the arrow will reflect both magnitude and direction. Using the already familiar techniques of editing PowerPoint slides, both the position and size of the Force Meter can be adjusted for the best representation of the force vector.
The Dartfish Graph tool allows you to display the real time force time series data in graphic form overlaid on the video clip. The tool is added and linked to the force plate’s data stream in exactly the same simple way as the Force Meter, plus various parameters such as the location of the origin and range of data displayed can be controlled. The real-time display of ground reaction forces allows the student to better understand the nature of those forces on movement of the body’s center of mass.
Data output from AccuPower Software allows for the display of forces in each direction and/or resultant horizontal forces. This allows students to better understand the three dimensional nature of force output.
And if it is simply the numbers which tell the best story then linking a Dartfish Text Box to the data source will give you the numerical ground reaction force data in real time.
Example: Integration of data and video to quantify and visualize power during a counter movement jump
The purpose of this lab is to visually display ground reaction forces, velocity and power using Dartfish to display data captured by AccuPower Software. Specifically, we will display (1) Vertical force (Fz), (2) Velocity in graphic and live form, (3) Power in graphic and live form during a counter movement jump test. Dartfish software will then let us create key positions – the points of peak power and zero velocity which can be marked within the video then exported as pictures (such as those below) or printed.
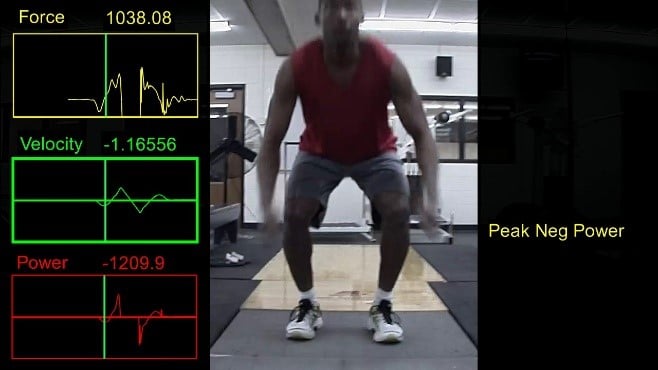
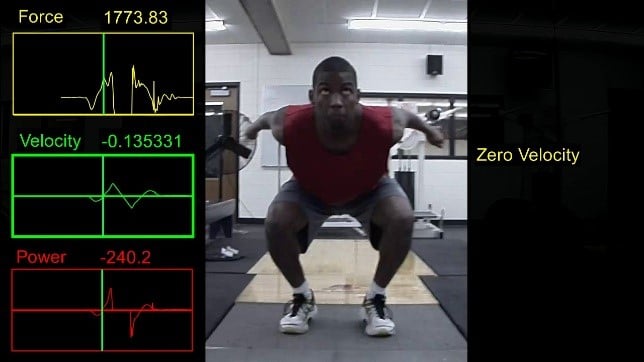
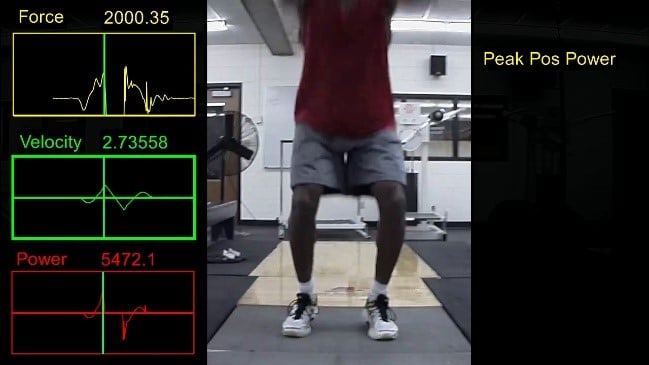
The Dartfish Graph tool displays the real time force, velocity, and power time series data in graphic form within the clip. The Dartfish Text Box tool allows you to display the real time force time series data in numeric form. These sets of text and graphs with their data links can be saved as overlays within Dartfish, allowing them not only to be reused but the most appropriate overlay used for each lab.
These two examples demonstrate how the integration of AccuPower Software and Dartfish provide biomechanics professors with the powerful toolset to effectively teach today’s students. Visit the AccuPower Software website for sample labs provided to help bring to life this valuable teaching resource.
Comments are closed.